Semantic BEV Mapping
Project2025For my first project class at ETH, Perception and Learning for Robotics, my partner and I worked on developing a model for semantic and elevation Bird’s-Eye-View (BEV) mapping. The model was meant to serve as a benchmark for the recently created dataset TartanGround.
For mobile robots, having an understanding of the surrounding area is crucial for path-planning and decision-making. For many applications, such as longer-term path-planning or obstacle avoidance, a 2D BEV map is sufficient. We also constructed 2.5D maps, which include a measurement for elevation. These can be useful for navigation because of added traversability information.
For this project, we started with a previous paper called PointBeV, which was at the time a recently published work that trained models for BEV obstacle detection for autonomous vehicles. The main contribution of this project was a sparse feature-pulling approach to mapping the obstacles from the camera to the BEV representation. We chose this work as a starting point because it was recent, had state-of-the-art results, and a solid code base to pull from.
 |
|---|
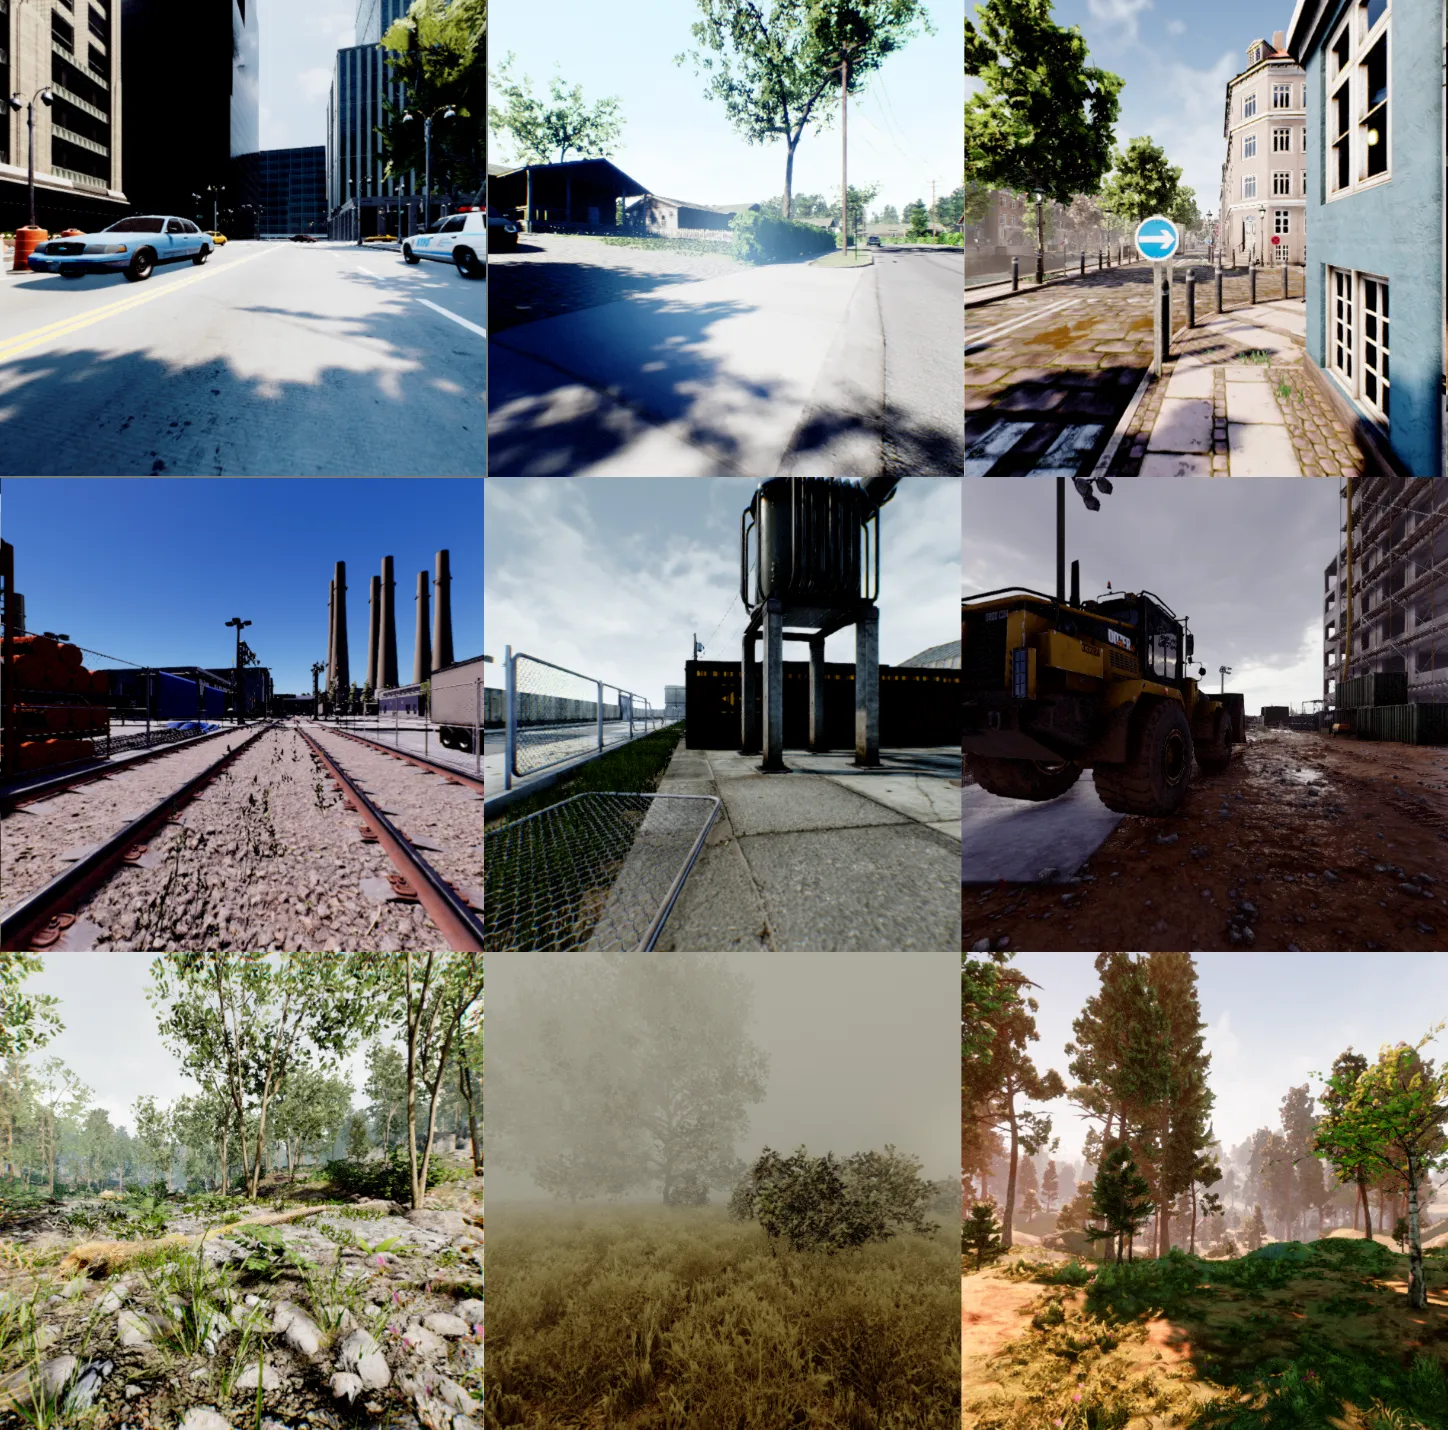
| We used 25 different environments from the TartanGround dataset for training, testing, and validation |
From here, we worked on constructing our training data from the TartanGround dataset. We needed to create BEV maps, group classes represented in the simulation into semantic classes useful for navigation, and put these into formats that would work well for training a deep learning model. I learned a lot about working with the Euler Cluster at ETH and managing large amounts of data (we were working with an approximately 1TB subset of the entire dataset).
 |
|---|
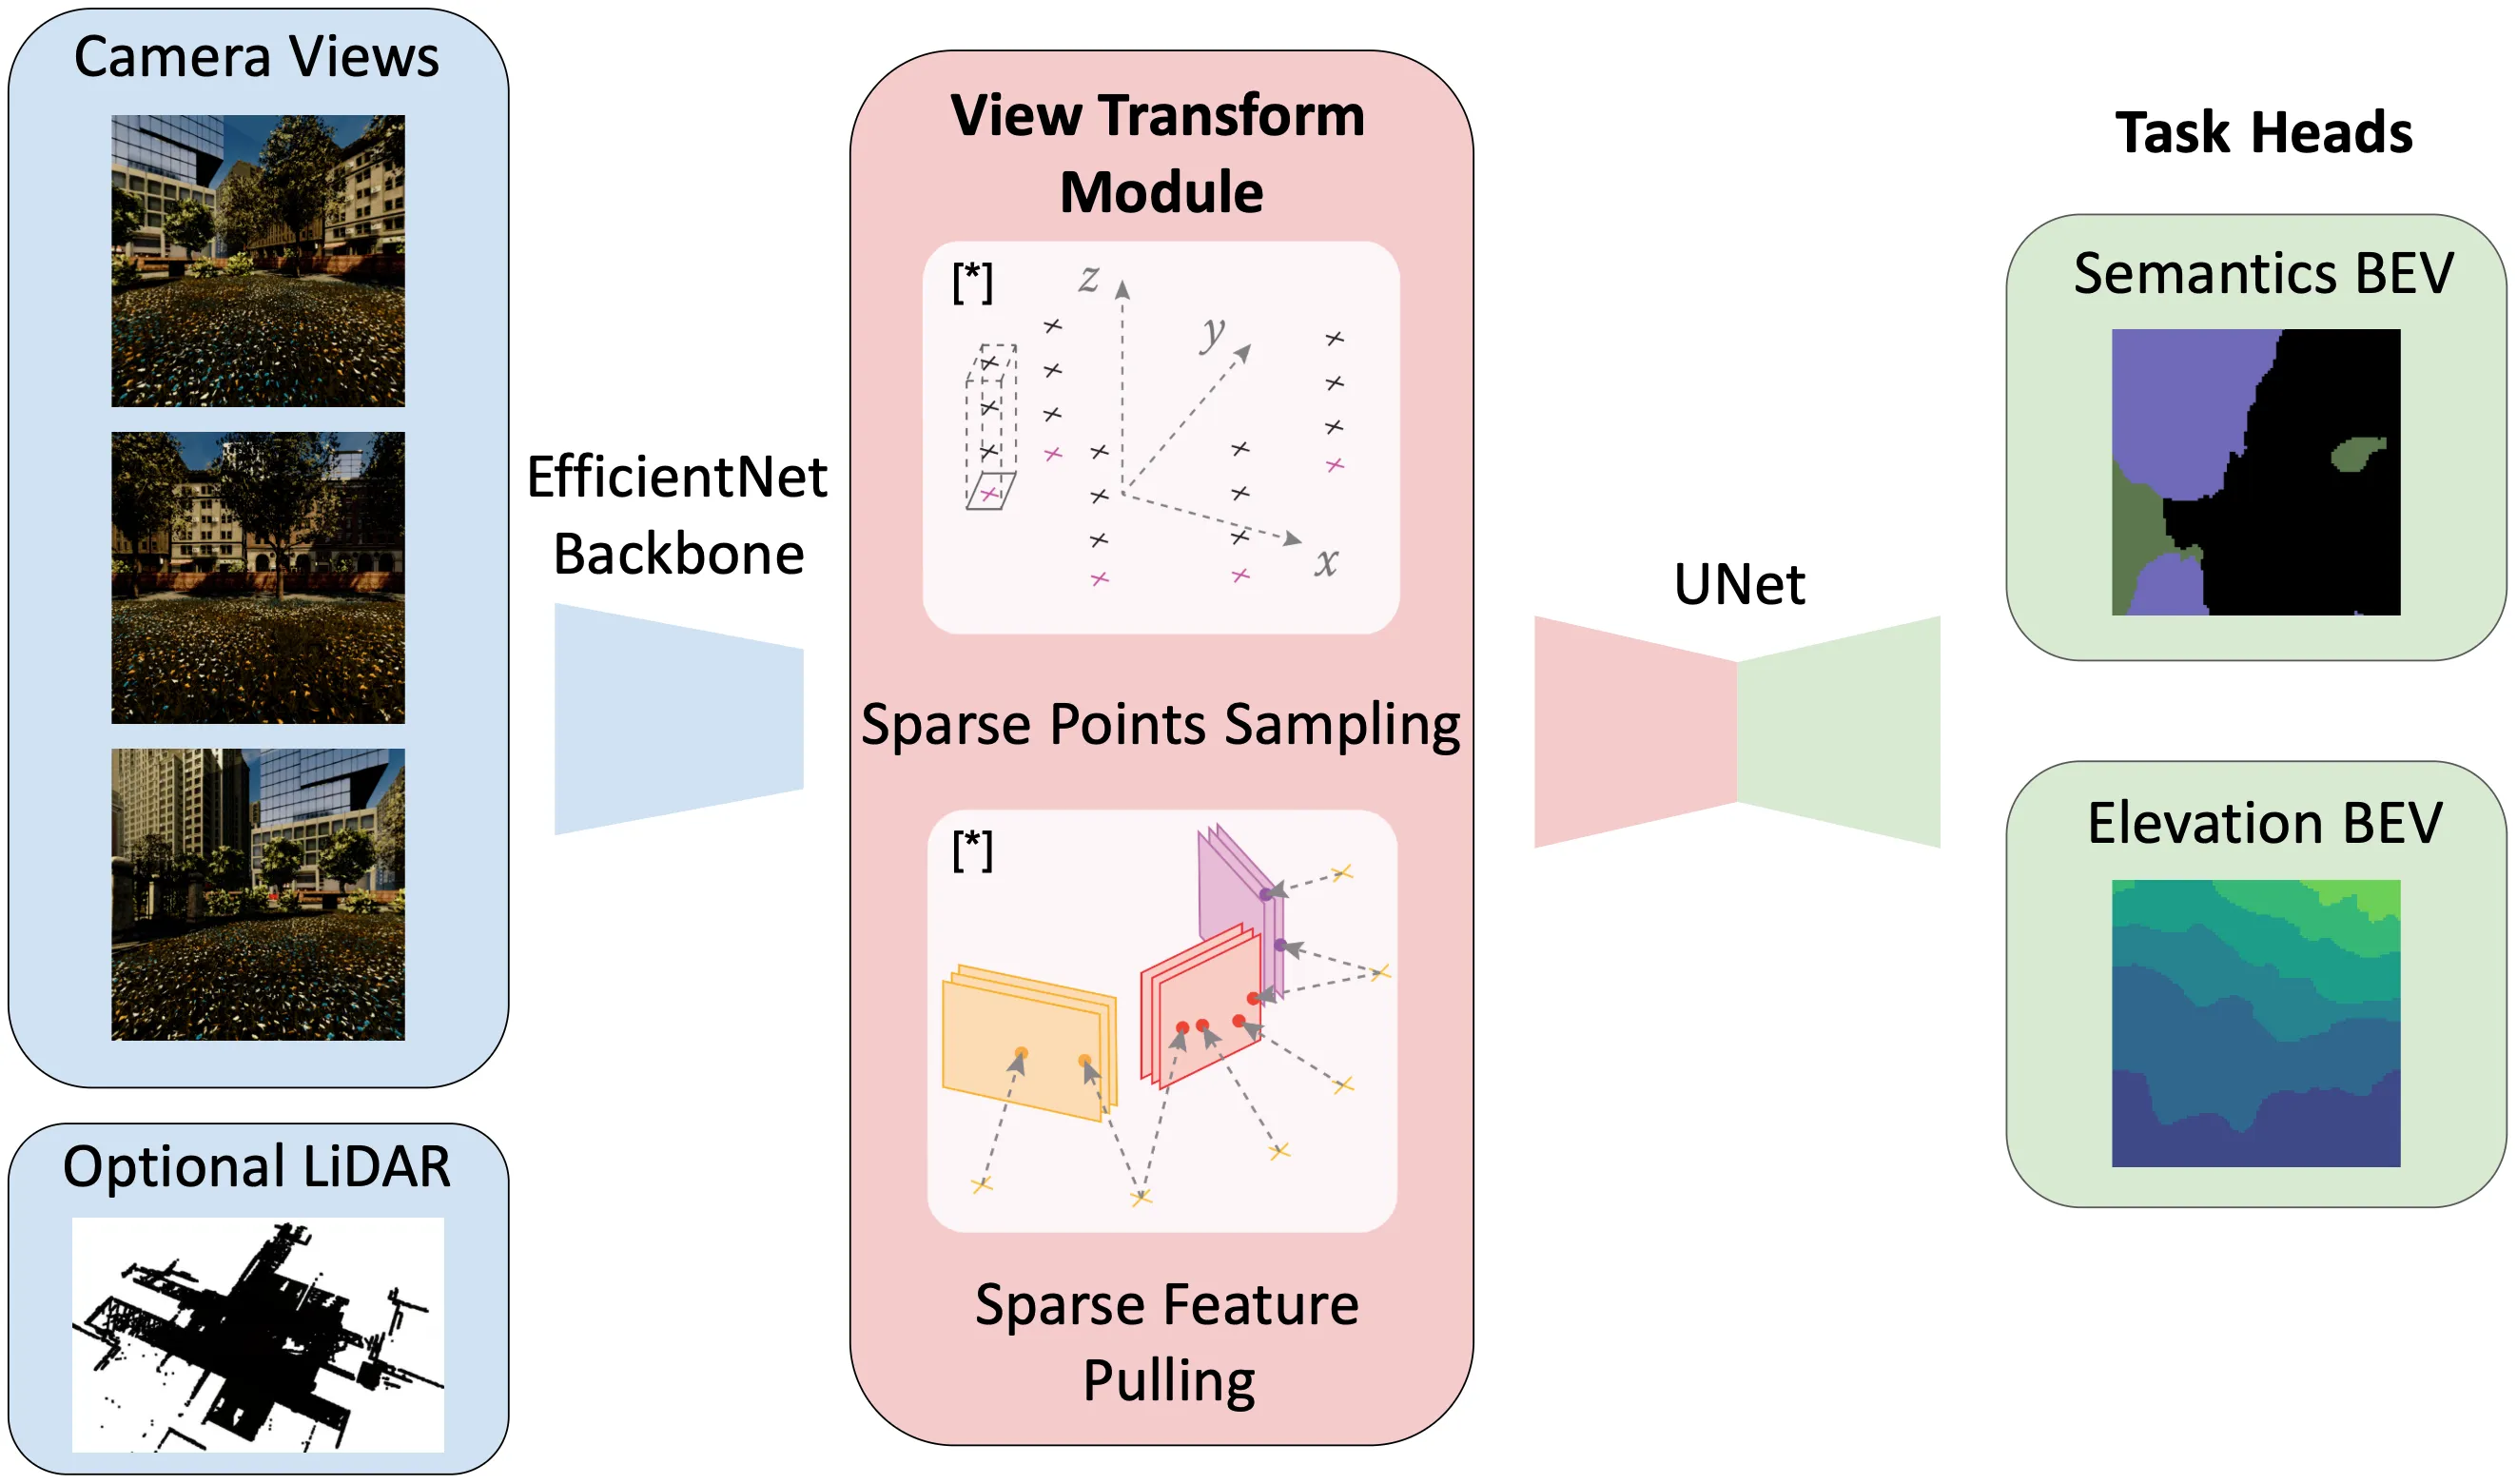
| Our model architecture was derived from the PointBeV paper, with two task heads for semantic and elevation prediction |
Once we had our training data, we trained a model on this data. We heavily modified the existing codebase to process more images at different camera-view angles, and to produce BEV maps with six different semantic classes, or 2.5D elevation maps as outputs. This was also a huge learning experience in PyTorch, more advanced deep learning libraries for research like PyTorch Lightning, and training large models.
In the end we had reasonable success with the models, creating nice demonstration videos for different types of environments, from natural to industrial to urban. However, there were also issues that stemmed from the available data. For instance, in some of the simulation environments, trees and low-lying grass were both labeled as “plant”, despite the fact that they have very different meanings for navigability. So for many of these environments, the model struggled to distinguish the navigable terrain from the non-navigable terrain.
 |
|---|
| An example of the inference results vs ground truth. Our model had reasonable success in environments similar to its training set |
If you would like to check out the implementation details, please feel free to read the report linked above.